Change is Good
Anjali McKenzie, Former UX Researcher
Article Category:
Posted on
Focusing on raw numbers only reveals raw numbers. Analytics, however, is more than raw data. It is about using data to understand trends, draw conclusions, and most importantly, to support decisions for your overall strategy. Often, when looking in Google Analytics or at a marketing report, many tend to focus only on the raw data. Which page has the most views? Which ad has the fewest clicks? Which traffic source drove more visitors? While spotting the highs and lows can be helpful, it is more useful to look at what’s changed, and why.
When you focus on what’s changed you focus on the data that matters, ask meaningful questions, and draw more actionable conclusions. For example, if you look at Viget’s top referring sites for August 2010, you get this (roll over to expand):
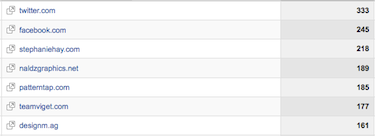
Here, you see that twitter.com is doing well, and there are a few other solid referring sites. But what are the action items that you can draw from this data? What do you do next now that you have this data?
Now, compare this to a report that shows Viget’s top referring sites for August 2010 compared to July 2010:

Here, you still see that Twitter is the top referrer, but what jumps out even more is the 704% increase in referrals from patterntap.com. With this change data you can start asking questions such as “what caused that increase in referrals?” Once you dig deeper to answer that question, you can then take action by repeating whatever you did in the first place to get that jump in referrals. Equally important are the decreases – “did we change something on teamviget.com that caused the decrease in referrals?” If you find certain referrers are on the rise, you can try to form relationships or partnerships with them, or vice versa.
There are two easy ways to see what’s changed in GA. You can simply use the date range, and check the “Compare to Past” box, and set your date comparison date ranges. We usually do month-over-month and year-over-year comparisons.

The other option is using the Intelligence feature. With intelligence you can set custom alerts on the daily, weekly, or monthly level. In our example below, we are creating an alert for a 100% or more month-over-month increase in referrals from Twitter.

The next time a client asks you “how many visits should I be getting on my About page” or “what should my average time-on-page be?” you can tell them, and now show them, that they need to focus on change rather than the raw numbers. Whether negative or positive, change is good.
If you have any tools, tips, or techniques that have helped you focus on change more effectively let us know in a comment!