Visualize Pull Requests with Checkoning
Doug Avery, Former Senior Developer
Article Category:
Posted on
The Viget development and front-end development teams use GitHub pull requests to critique and improve code on all our projects. I built a tool for visualizing how the team members comment on each other's PRs, and exposing some neat facts about the interactions.
Checkoning (GitHub link) does three things:
- Pulls down PR data for a specific team and saves it as a massive JSON file.
- Digs through the raw data to find interesting data to visualize.
- Expose the data on a single page, mostly using D3 visualizations.
The results from running it on Viget teams are pretty cool:
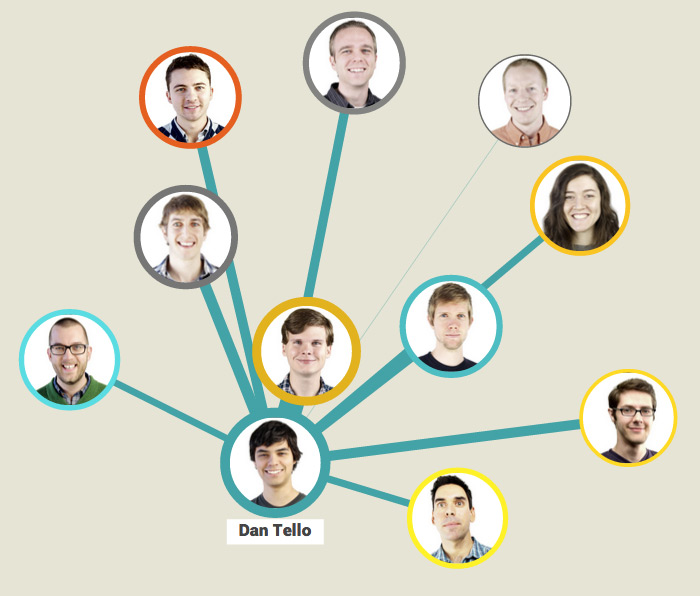
Force-directed graph of who Dan comments on most (and vice versa)
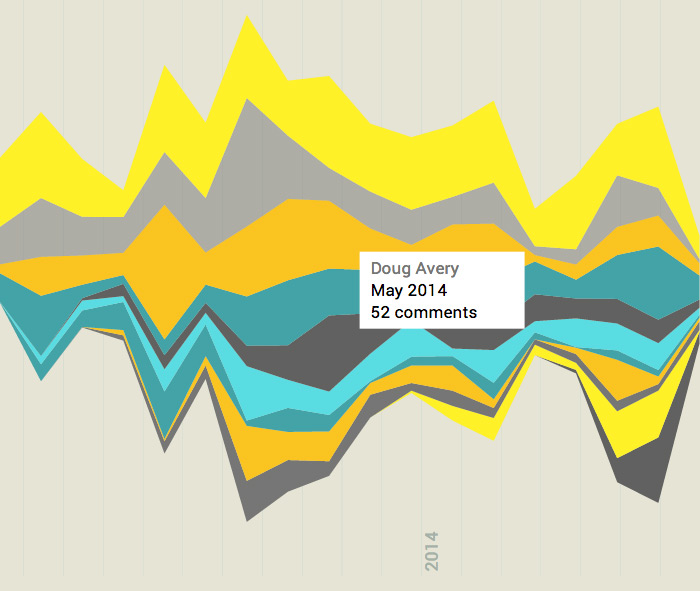
Had a slow May, I guess.
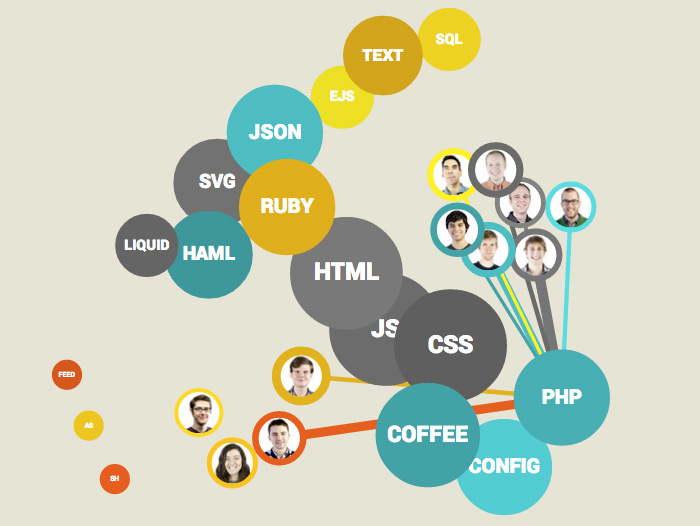
Tommy sure likes PHP.
Even though Checkoning is just an experiment, you can clone it and run it on your own teams. Teams roughly the size of Viget’s should work fine, but other sizes will need some tweaking to produce nice visualizations. Have fun!