Using Google Analytics API - I got the Magic Script
Ben Travis, Former Marketing Manager
Article Categories:
Posted on
Simply put, Google’s Magic Script makes accessing Google Analytics from within Google Spreadsheets as easy as falling off a log. If you look at web analytics often, do yourself a favor by familiarizing yourself with this Google Analytics solution, and be sure to try the templates shared later in the article. In this post, we’ll go over the benefits of Magic Script, how it works, and how you can use it to make your life easier.
Providing Insights Should Be Your Priority
Why is this such a big deal? Your priority should be analyzing and gaining insights from your data, not capturing and reporting it. The more efficiently you gather data, the better prepared you’ll be to glean insights and drive actual change. At the same time, you’ll look smart and save time - a win-win! Magic Script costs nothing and is well-suited for plenty of uses, including:
- Data or charts that need to be shared publicly or internally. Google Spreadsheets gives you access to interactive charts and tables, which you can share with others. These can be posted anywhere online, even an internal site or wiki page. This gives you control over what data is released and lets you update external charts from within the spreadsheet. Below is a quick example of an embedded chart:
- Periodic reports, such as those run on a monthly or quarterly basis. The Google Analytics browser interface is simple to use, but you may still find yourself pulling the same reports and pasting the same data points into spreadsheets or emails, which can eat up hours every cycle. With Magic Script, you can update all of your reports with one click (or no clicks if you use triggers!) and move on to more important tasks.
- Quick snapshots - a set of metrics that you review every day. If you find yourself looking at the same reports every day but want to save time, you can use Google Spreadsheets to lighten your load. Setting up a daily dashboard to monitor activity saves you from running reports and shows data from multiple reports in one view.
- Automatically updated reports. Need to have reports update without you there? Google Spreadsheets allows you to set “triggers” or instructions on when to run. For example, you can set reports to run every Monday morning, so you can start your week analyzing data, not organizing it.
How Does The Magic Work?
Now that you’re convinced this is the solution for you, let’s look at what Magic Script does in more detail. In the GA browser interface, you often pull data from disparate reports with various filters and segments applied. Magic Script let's you pull the exact information you need into a single view in a way that's more flexible than GA's built-in dashboards or custom reports. The API normally requires some programming knowledge, but this solution allows lay-users to easily take advantage of its capabilities.
If you feel like you’ve read about the Google Analytics Core Reporting API on our blog before, you’re not going crazy. Mitch recently wrote a post on another Google Spreadsheets plugin - the Thuneberg GA Data Fetch script. However, Magic Script differs from Thuneberg and other API access methods. There are a few reasons why you might want to use Magic Script instead of other Core Reporting API methods: For example:
- This Google Spreadsheets plugin was released by Google and built by Googler Nick Mihailovski.
- Security is based on the permissions of your specific Google account, so there’s no need to enter any login information anywhere on the spreadsheet.
- Data sampling indication is available in reports - so you’ll know whenever you’re working with controlled data.
- It’s free!
One potential drawback, however, is the work needed to make additional reports. There are some cases where a more flexible solution may be more appropriate.
Try These Dashboards
In order to make Magic Script even easier, we’ve created a couple of dashboards to give you a head start. If you’re familiar with Magic Script (and dimensions & metrics and GA API formatting), you’ll notice that creating reports should be more intuitive with the help of spreadsheet functions. For those who want to create customized reports from this template, I would suggest reading the “Notes” sheet.
Setting Up Dashboards
While you can certainly build your own reports via Google’s instructions, here are the basic steps to set up one of our dashboards:
- Make a copy of the dashboard version you’d like, rename, and open the copy.
- Turn on access to the APIs for your first time. Looking at the tabs on top, Script Editor > Resources > Use Google APIs > Make sure Google Analytics API is on.
- Script Editor > Resources > Use Google APIs > Click “Google APIs Console” > Turn Analytics API On > Agree to Terms.
- Go to the “gaconfig” sheet and enter the profile number for a view you have access to. You can find the profile number either by:
- Going to the Google Analytics tab and choosing “Find profile / ids”
- Bringing up a report in the Google Analytics interface in that specific view and copying the number from the URL after the letter p.
- Go to “Dashboard” sheet and run “Get Data” from the Google Analytics tab.
- This app needs authorization to run Yes > Accept.
- Good, now you never have to authorize or turn on APIs for this sheet again. Run “Get Data” once more.
- Your script should run and let you know everything went well and...boom! There’s data!
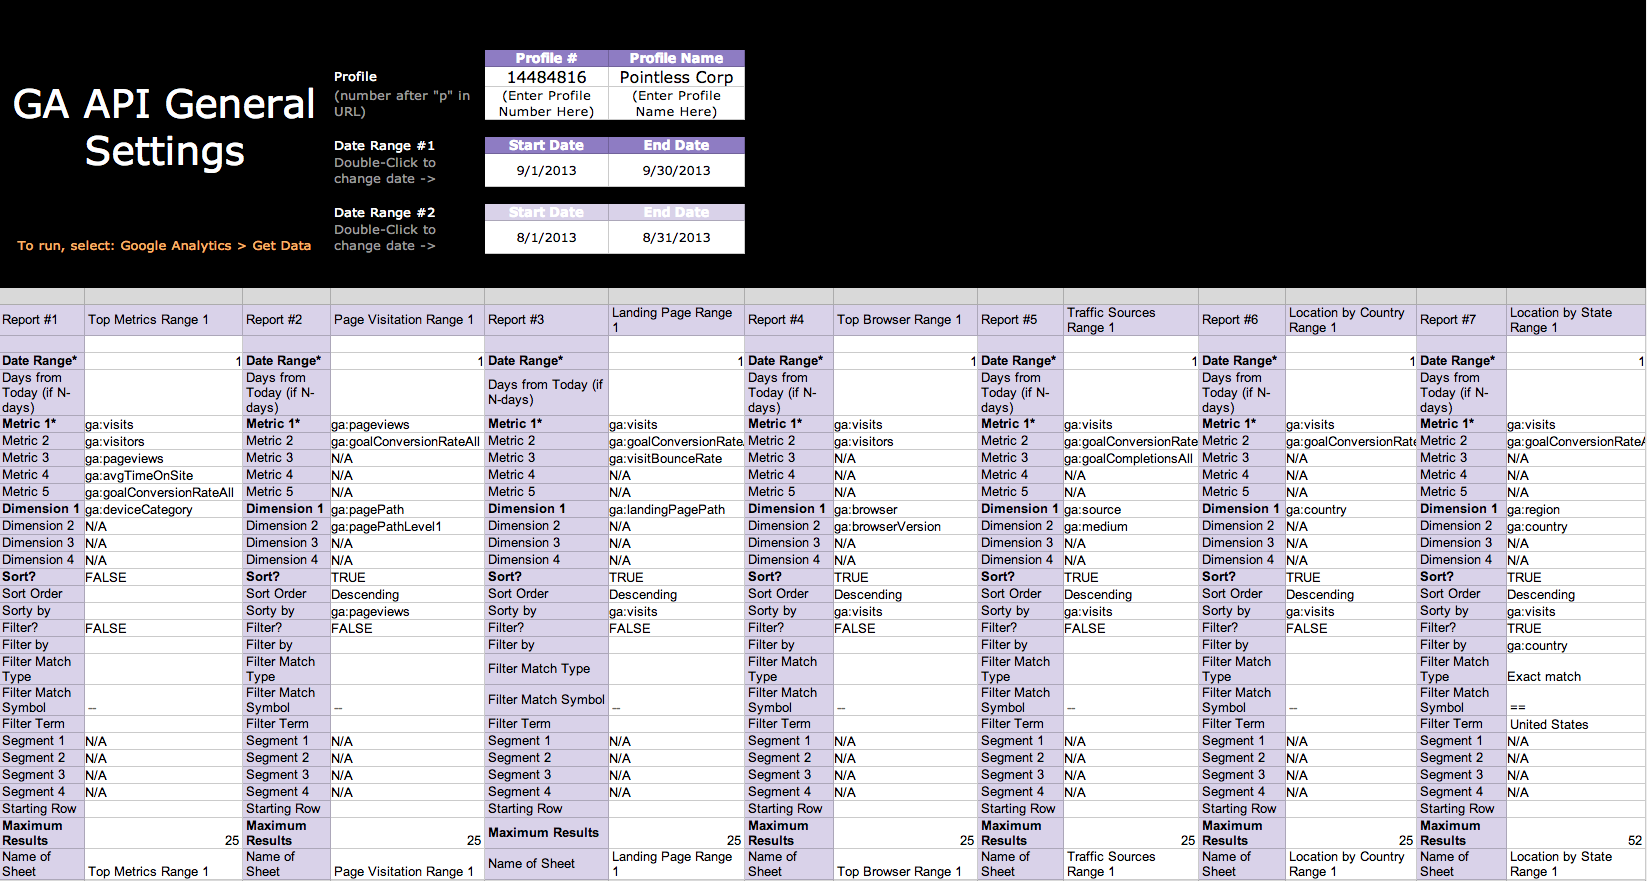
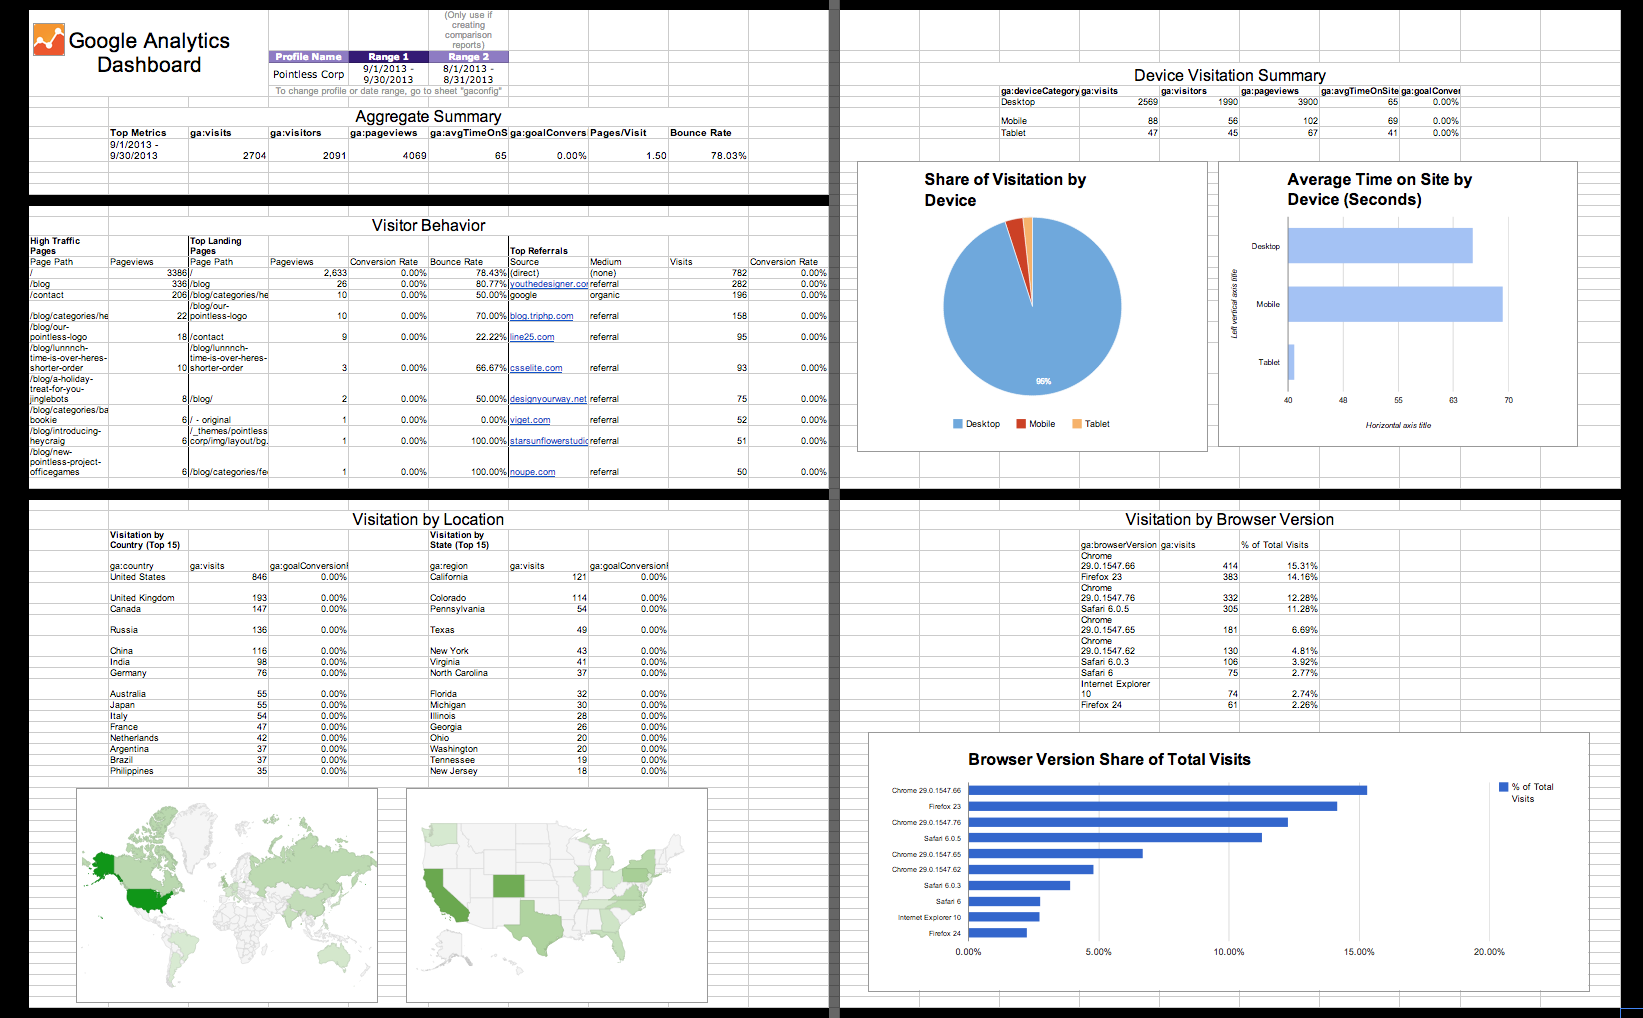
At first glance, the sheets might be a bit overwhelming, but stick with me for a bit. Your control board is “gaconfig,” where you’ll enter all of the report details before running. Start with any basic information such as your profile/view number and any date ranges you’d like to look at. All other query parameters should be familiar if you’ve run any sort of Google Analytics report in the past, but for more details, check out the “Notes” sheet. “RawDataSheet” is simply an aggregation of all reports run (so feel free to hide this guy). “Dashboard” is where you’ll find all of your reports in a simpler form.


Note: Sometimes the script will look like it’s still running, even when it’s finished. If it’s been longer than 2 minutes, try to close and reopen the spreadsheet.
A big thanks to Google and Nick Mihailovski for a great integration between products. We’ve found a number of different uses for Magic Script and the Google Analytics API and hope you’ve learned a bit more about web analytics from our work. Finally, feel free to share anything you’ve improved, found, or created with the Google Analytics API!