Animation Performance 101: Measuring with Dev Tools

Chloe Hwang, Former Front-end Developer
Article Categories:
Posted on
Your ultimate guide to animation performance — always be measuring.
In the last part of this series, we’ll take a look at the most important part of performance: how to measure and diagnose bottlenecks. Performance optimizations are meaningless without data! We’ll go through how to analyze using Chrome DevTools*. First, let’s take a look at two tools mentioned in Part 1.
*written for Chrome 72 — features may be outdated or deprecated on newer versions.
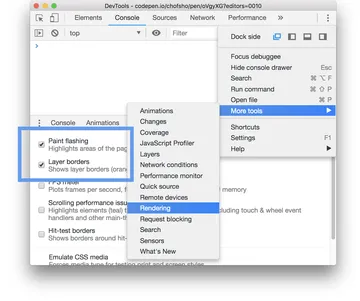
Paint Flashing and Layer Borders #
Paint Flashing highlights the parts of a page that need to be repainted by flashing them in green. Paint is usually the longest-running step of the rendering process, making it important to minimize whenever possible. Unnecessary Paint can be caused by style changes on parent elements that flow to child elements, or by using Layout properties like top or left instead of Composite Layers properties like transform.
Layer Borders shows what compositor layers are on the page by outlining them in orange. Layers are important to monitor because they can both help and hurt performance. We want layers to show up when we’re expecting an animation to be hardware-accelerated. But we also don’t want too many layers because each takes memory and resources to manage.
They can be found in the Rendering tab under More Tools.
Analyze Runtime Performance #
The most important thing to measure is an animation’s runtime performance. We want to ensure it runs well for all devices, from low-end phones to high-end desktops. The best animations run seamlessly no matter the user’s device or connection quality.
Let’s walk through a tutorial using our bouncing boxes example from Part 2 (tweaked slightly to fit this guide). First, we’ll analyze the unoptimized version.
Get Started #
- Go to this link in Chrome and open DevTools.
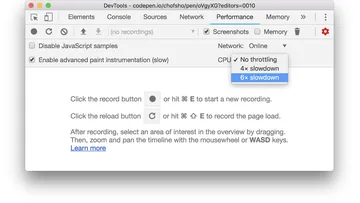
- Click on the Performance tab and make sure the Screenshots box is checked. Click on Capture Settings (red gear icon) to open additional settings.

- Let’s simulate a less powerful device by slowing down the CPU. This is useful because mobile phones have much weaker CPUs than desktops. Select 6x slowdown. The boxes should now move noticeably slower.
⭐️ Note:
|
Take a Snapshot #
Now it’s time to take a recording of the animation so we can analyze how well it performs and where there might be unnecessary work.
- Click the Record button. Let it run for a few seconds before pressing Stop.
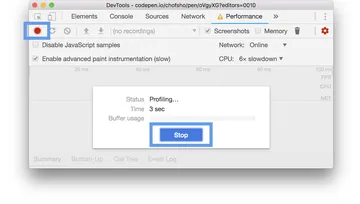
- Here are the results! You’ll notice it looks very colorful, and maybe a little nonsensical 😳 It’s definitely a lot to take in so let’s go through step-by-step.

Analyze the Results #
The first thing to understand is the results show how the animation changed over time. If you hover over the area that looks like screenshots, you’ll see how the animation looked at that point in time:

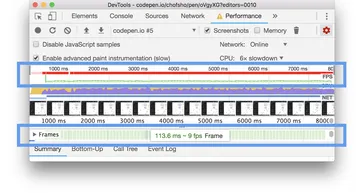
- Let’s start by reviewing the animation’s FPS. Animations must hit a rate of 60 frames per second to feel silky smooth to the user. Take a look at the FPS Chart. The green bars correspond to the FPS rate. You want them to be tall — the taller the bar, the better the rate. You don’t want to see a red bar above the green — that indicates the FPS was too low to the point where it hurt user experience. Another place to view FPS is the Frames section. You can hover over each green square to see what the FPS was for that particular frame.
- Next, let’s look at how the CPU performed. If the CPU is taking on too much work, it may lead to skipped animation frames. You can view this in either area chart or pie chart form:
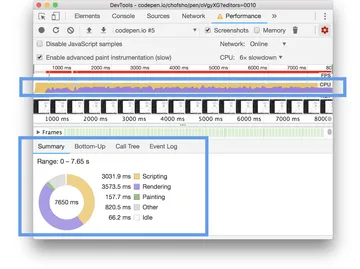
If the charts are full of color, that means the CPU was maxed out and it’s a sign we need to minimize work. The colors correspond to each step of the rendering process: yellow for Javascript, purple for Recalculate Styles and Layout, and green for Painting and Composite Layers. A lot of purple here means we’re probably running into forced synchronous layout.
- Now, let’s look at the Main Section to see exactly what was happening on the main thread. You can zoom in on a specific slice of the recording to better see the activity.
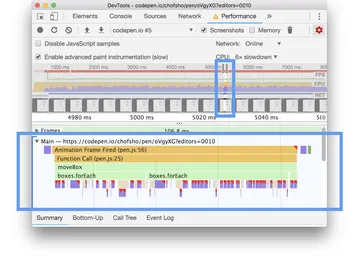
See “Animation Frame Fired” — this event fires whenever requestAnimationFrame() is called. The stack of bars tells you the order in which things were triggered. So here, “Animation Frame Fired” made a function call to the callback moveBox, which then triggered the boxes.forEach inside it.
boxes.forEach then triggered what looks like a bunch of purple and light tan events. The purple events have red triangles on top — this indicates there was an issue with the event. If we click on one, we can see more details in the Summary tab below:
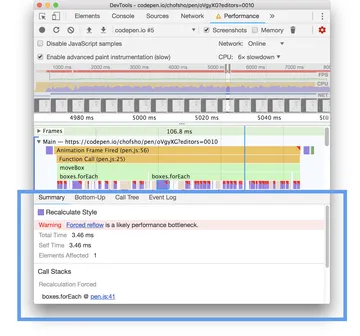
Here, you can see it was a Layout event and we see the corresponding warning about forced reflows (a.k.a. forced layout). Seems like this event was forced by the Javascript above. Note where it says “Layout Forced” and gives the link pen.js:41 — this takes you to the line of code that triggered this Layout event.

That was our box.getBoundingClientRect(). Again, we know this forces layout because we are reading from the DOM after we change it on line 37.
Ideally, the browser wants to do all Rendering events (purple) after Javascript completes. An animation that doesn’t force layout would look something like this, where there is no purple under the yellow:

From this analysis, we can see the major bottleneck is forced synchronous layouts by our Javascript. That’s what’s creating unnecessary work and maxing out the CPU. With this in mind, let’s analyze the optimized version to see how it differs.
Optimized Version #
Here’s the recording of this version’s runtime performance:
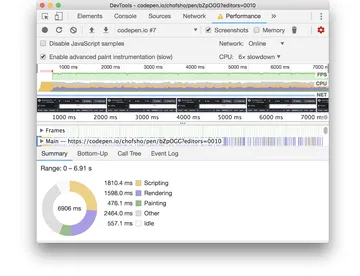
You can see right away how much better this looks from the unoptimized version. First, we’re achieving consistency high FPS and there is no red bar above the FPS Chart. Second, the CPU charts are not filled with color and we’re doing much less Rendering work than before. We can also see there are no more forced layouts when we zoom in on the Main section:
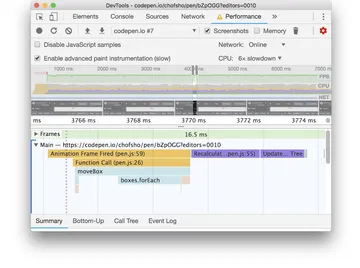
No more purple under the yellow, red bars, or red triangles — hooray! This was achieved by applying just a few optimizations:
- Doing all DOM reads before DOM writes.
- Caching any DOM queries that can be saved ahead of time.
- Animating
transforminstead ofmargin-left.
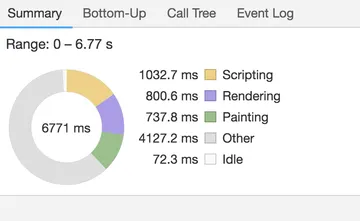
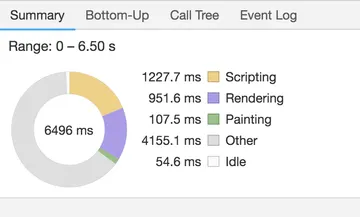
Let’s close out with a final chart that shows the important of #3 — using properties that trigger Composite Layers instead of Layout. The left chart shows the bouncing squares animated with margin-left, while the right chart is with transform. You can see how much Paint time is reduced by changing just one line of code!
-
margin-left
-
transform
Onward #
Animation performance isn’t just about knowing what CSS properties to use — “Oh just use transform and opacity” or “translateZ will fix that”. To be great at animation performance, it’s important to understand the whys and hows — how the browser renders under the hood, why that matters, and how to measure optimizations.
I hope this series helped give you that knowledge!
