A Day in the Life: Digital Analyst Mitch Daniels
Mitch Daniels, Former Senior Digital Analyst
Article Category:
Posted on
Awesome people do great work at Viget every single day. Digital Analyst Mitch Daniels documented a typical Friday to provide a behind-the-scenes look at his day-to-day life on Viget’s Data and Analytics team.
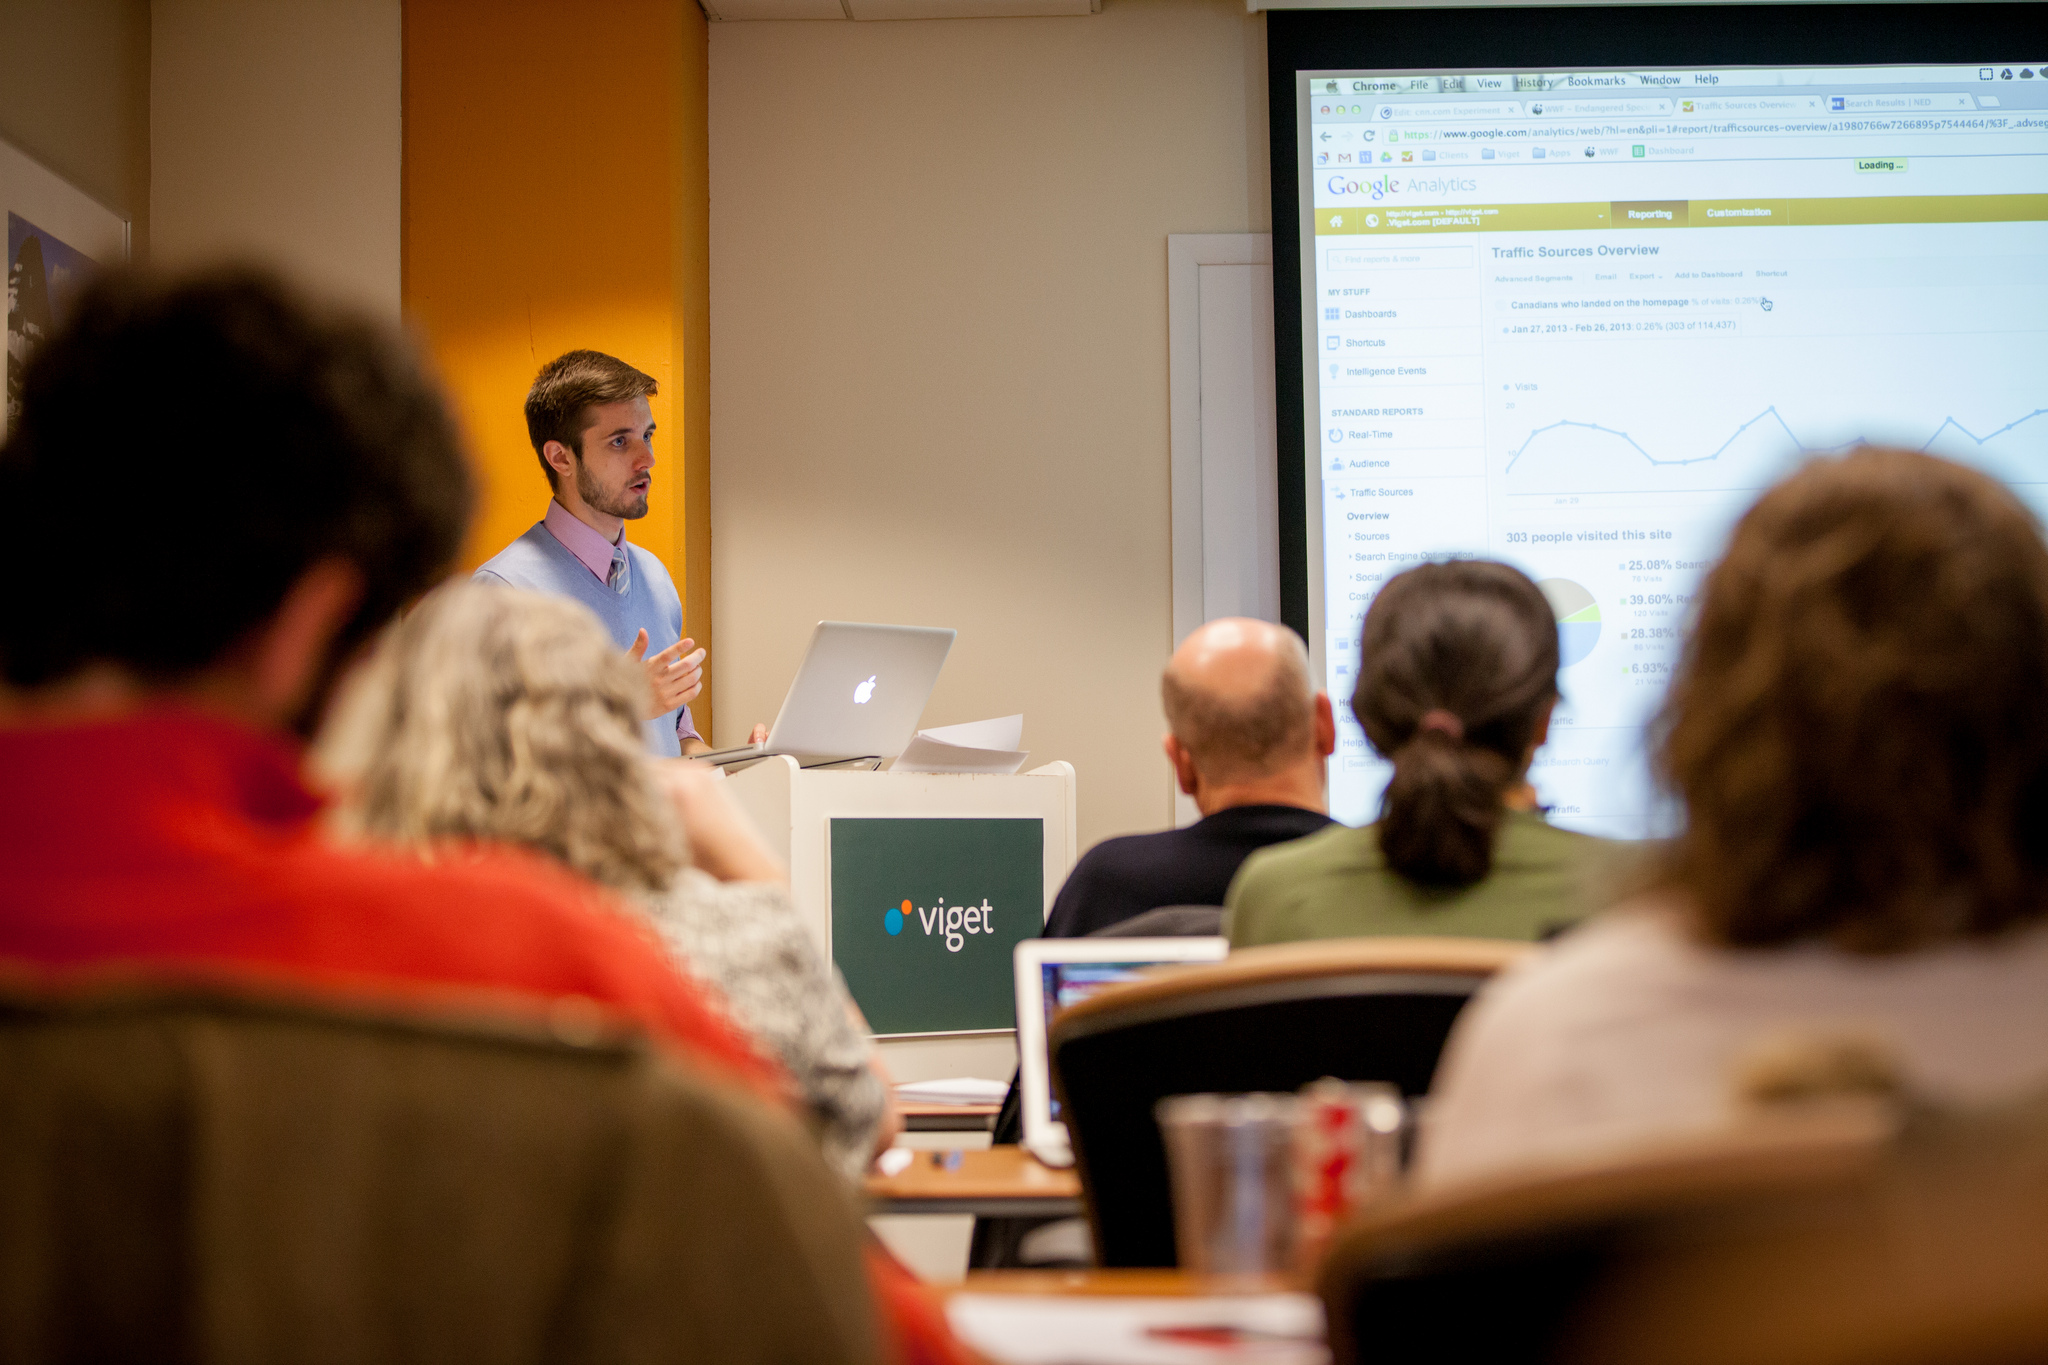
9:30a - Starting with The Most Important Thing
I park my car, grab my bag, and head into the office. I was off-site the past two days leading a Google Analytics training for a client in DC, so I anticipate today will be pretty busy. As I walk to my desk, I see that some beautiful soul has left me a warm Sausage Egg McMuffin. I know right away it’s from Cindy, our resident Diet Coke and McDonald’s buff. She buy-one-gets-one free every few weeks and has learned that I’m the only other person in the office who relishes that type of “food."
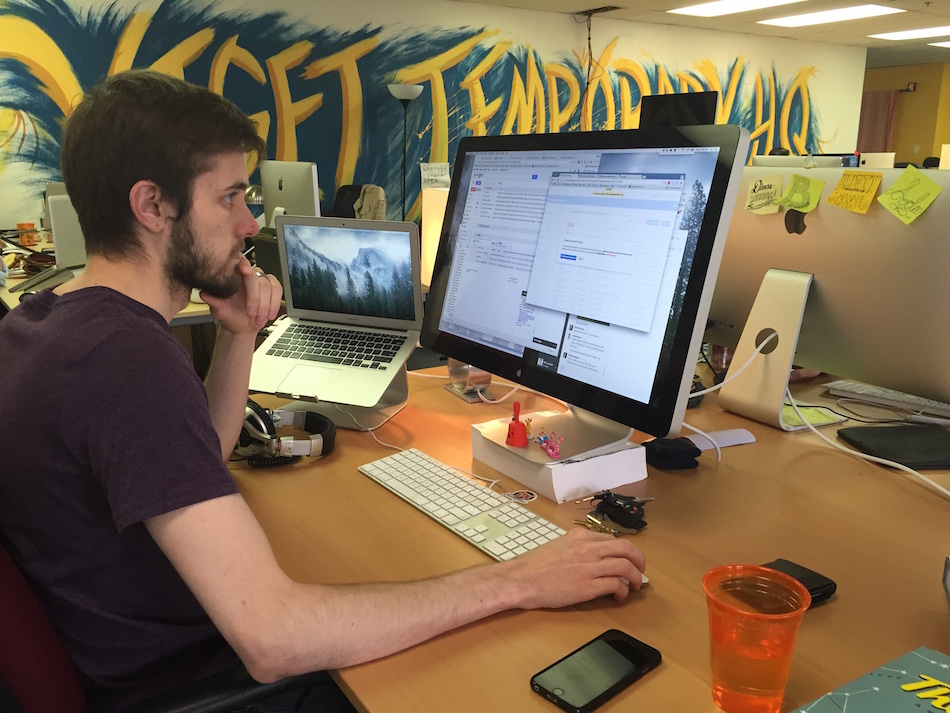
9:40a - Managing my inbox
After grabbing a cup of water and devouring my prize, I pop open my Macbook and lay out my plan for the day. My inbox has quite a few new messages, so I spend some time looking them over and prioritizing those that require attention. I use ActiveInbox to manage my email, so once I’m done I have a clear, ordered list of tasks.
I take a look at my calendar for the day and see solid meetings from 10:30a - 2:30p. I’ll have a few minutes this morning to knock out some emails, but the rest will have to wait until this afternoon. So it goes.
10:30a - Kicking off a project
I had time to respond to a few emails and Basecamp posts, now I’m off to an internal project kick-off meeting. Sam, Anjali, and I grab a room at temporary HQ and join a Google Hangout with off-site team members Trevor, Lance, Billy and Amanda. We spend the next hour
reviewing the upcoming project: goals, timeline, budget, plan and potential challenges. We’ll officially kick things off with the client in a couple weeks, but these internal check-ins allow us to prepare and address any questions or concerns before we begin in earnest.
11:30a - Standing up
Next up is the Data and Analytics team Weekly Standup. Paul, Ben and I meet up in Stopgap (one of our temporary HQ meeting rooms) and join a Google Hangout with Jackson (in Boulder, CO) to review the previous week and look ahead toward upcoming work. In turn, we look over our hours in “RPM” - a monstrous Google Sheet that tracks our planned hours across every project. We’ve all been pretty busy over the past few months, and this week is no exception.
We work with Jackson to prioritize projects and shift hours as necessary to ensure we’re getting everything done while maintaining a reasonable workload. Once we have that sorted, we talk more generally about thoughts or concerns that might impact the team. I share some thoughts about my recent training experience, and we discuss ways we can further improve and refine those types of engagements in the future.
12:30p - Eating a Free Lunch (They *do* exist)
Free Lunch Friday (FLF)! Every week, all of Viget gathers to share a group lunch lovingly provided by Brian and Andy. We share casual conversation over food, then each office spends some time highlighting recent happenings and project work. This week at HQ it’s District Taco, a crowd-favorite. After loading my plate up with fish tacos, I grab a seat next to Ryan, and we chat for a while before Brian kicks off the FLF update.
Brian shares the progress of construction on the new HQ, reviews a few potential leads for new work, and then hands it over to the Durham and Boulder offices who each do the same. After the updates, it’s time for Labshare, where one lucky Viget each week gets to present about a topic of his or her choice for 15 minutes. This week, Sam, a Project Manager, is up, and she presents on “The Five Languages of Appreciation in the Workplace.” It’s a fantastic talk, and quite a few folks are chatting about it even after she wraps up.
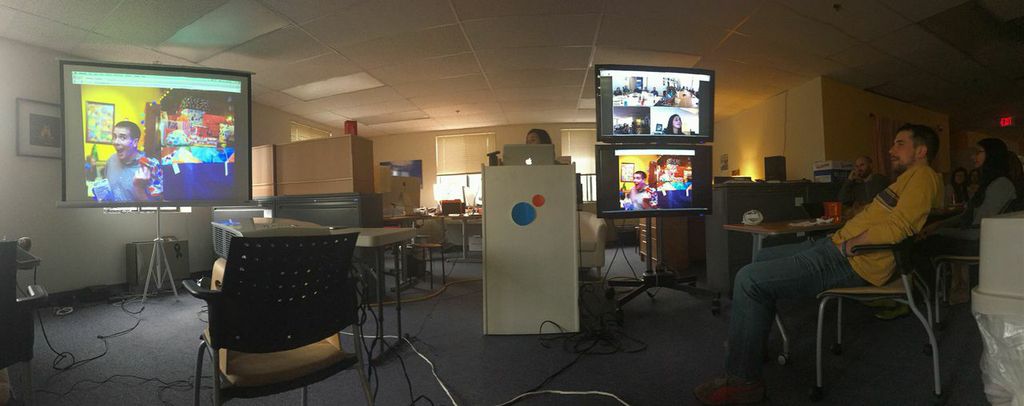
Sam presents her Labshare. Paul demonstrates his love language - gifts!
1:30p - Calling a client
Time to jump into a client call. I’m on the phone with four client-side folks and am talking through GA’s e-commerce tracking capabilities and the types of data it collects. They recently launched a new site, so we discuss what data they need and what reporting format and frequency works best. While the call is scheduled for an hour, we wrap up earlier than expected. I’ll deliver a draft report to them early next week, and we’ll go from there.
2:15p - Slacking
I have a few spare minutes before my next (and last) meeting of the day. Just enough time to respond to a couple emails and check up on the conversations happening in Slack.
2:30p - Checking in with Mr. Manager
Jackson and I have a standing bi-weekly one-on-one to talk about how work is going and how I can keep striving toward my annual goals. This week we chat a bit more about the GA training from earlier in the week and discuss some recent challenges I ran into while working with 3rd-party developers to implement specific GA tracking code. As always, he offers some great guidance.
3:00p - Crossing things off the to-do list
Done with meetings. It’s time to dedicate the rest of the day to the tasks waiting in my inbox.
A sampling:
- Update and publish a Google Tag Manager container for a site going live early next week. The container includes basic GA tracking code as well as some custom event tracking.
- Update a monthly dashboard to incorporate client-provided March sales data. The dashboard (built in Google Sheets) grabs data from the GA API automatically and places it alongside the client-provided offline sales data.
- Provide thoughts about an upcoming sales opportunity.
5:30p - Playing around with R Studio
I wrap up today’s tasks a little earlier than expected, so I spend the last part of my day playing around with RStudio. While this time isn’t billable, I account for it as ‘Professional Development’ on my timesheet. Viget encourages professional development and supports us spending time each week exploring, learning, and playing with new tools to continually improve our skill sets.
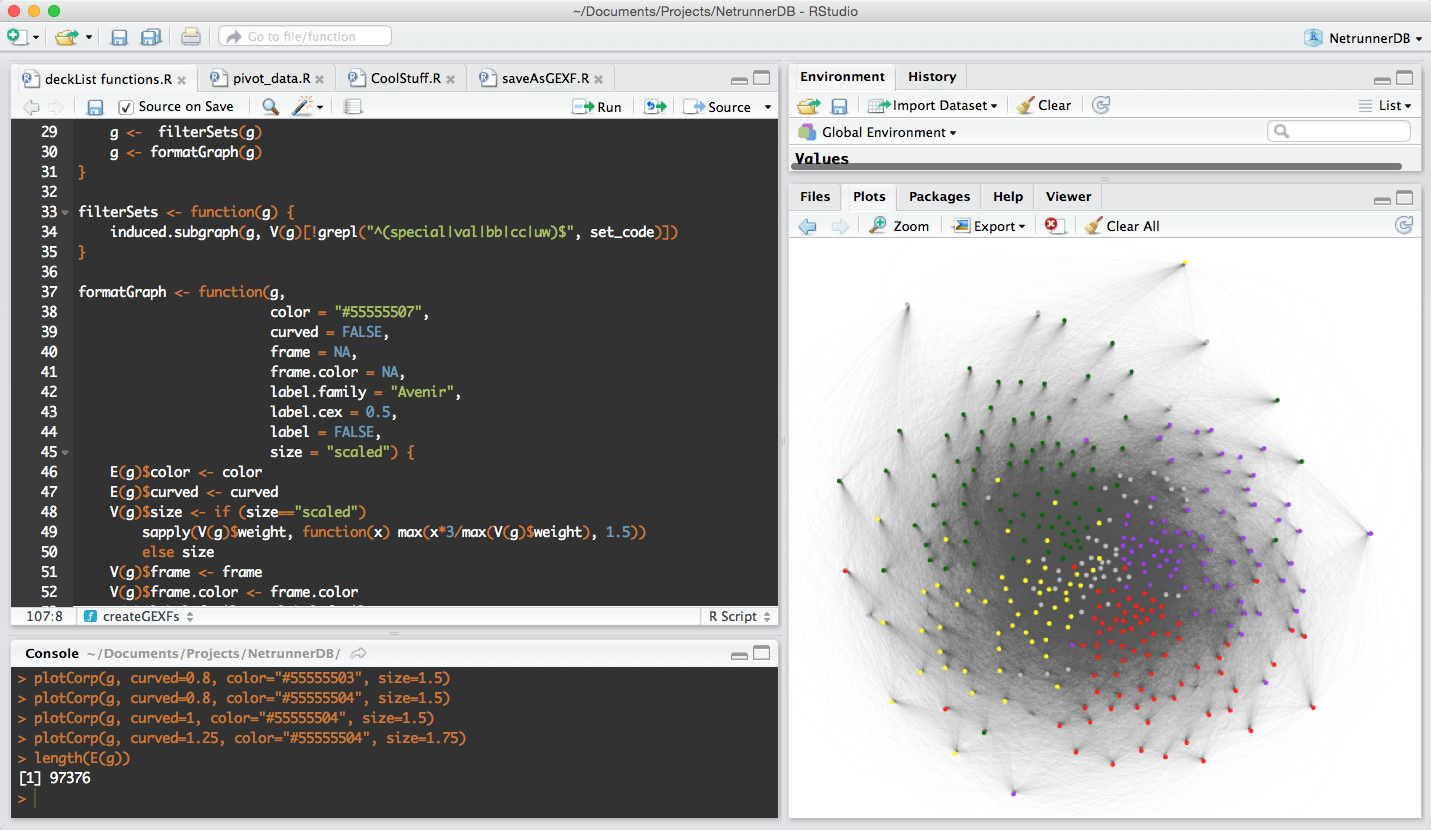
NetrunnerDB deck data visualized with R's iGraph library
I’ve been taking a Coursera course in R and am using what I’ve learned so far to build a social network graph related to one of my favorite board games. Nerdy, but awesome.
6:30p - Dropping the Mic
Time for the weekend! I clean up my desk and grab my computer (I’m planning to play around with the RStudio stuff more this weekend). After some goodbyes to the few folks still hanging in the office, I’m out.
---
Working on the Viget Data and Analytics team is awesome. Interested in finding out for yourself? We’re hiring!